
VR Module · Chemistry · Sciences
Thin Layer Chromatography
TLC - Rf Value - Separation
See it
Inside the module.
Learning objectives
By the end of this module, students will be able to:
Understand the principle of thin layer chromatography
Identify the role of the stationary phase, mobile phase, TLC plate, solvent chamber, capillary tube, and sample spot
Perform sample spotting and solvent development in a virtual lab setup
Observe separation of components based on polarity, adsorption, and solubility
Understand the solvent front, baseline, compound spots, and visualisation methods
Calculate and interpret the Rf value for organic compounds
Relate TLC to compound identification, reaction monitoring, and purity testing
A complete TLC workflow, in a virtual chemistry lab.
Thin layer chromatography is a widely used analytical technique for separating and identifying compounds in a mixture. It works on the differential movement of compounds between a stationary phase - usually silica gel or alumina - and a mobile phase, usually an organic solvent or solvent mixture.
In this iXRLabs VR experiment module, students perform the TLC workflow step by step. They prepare the TLC plate, mark the baseline, apply the sample with a capillary tube, place the plate inside the developing chamber, observe solvent movement, and identify the separated compound spots after development.
Why run TLC virtually?
- Solvents, plates and sample material are consumed on every run, so students rarely get more than one attempt.
- The common errors - overspotting, wrong solvent level, disturbed baseline - waste a plate each time they happen.
- In VR each separated band can be clicked to reveal its identity and structure, which a real plate cannot do.
- Rf measurement can be repeated until students are confident about what they are measuring and why.
The apparatus
- TLC plate / silica-coated glass slide
- Solvent chamber and mobile phase
- Capillary tube for spotting
- The sample - for example, a pigment extract
- Baseline, solvent front, and separated bands
Concepts it makes tangible
- The principle of chromatographic separation
- Stationary phase versus mobile phase
- Separation by polarity, adsorption, and solubility
- Baseline, solvent front, and compound spots
- Calculating and interpreting the Rf value
- Uses in identification, reaction monitoring, and purity testing
The experiment workflow
- Spot the sample on the baseline
- Develop the plate in the solvent chamber
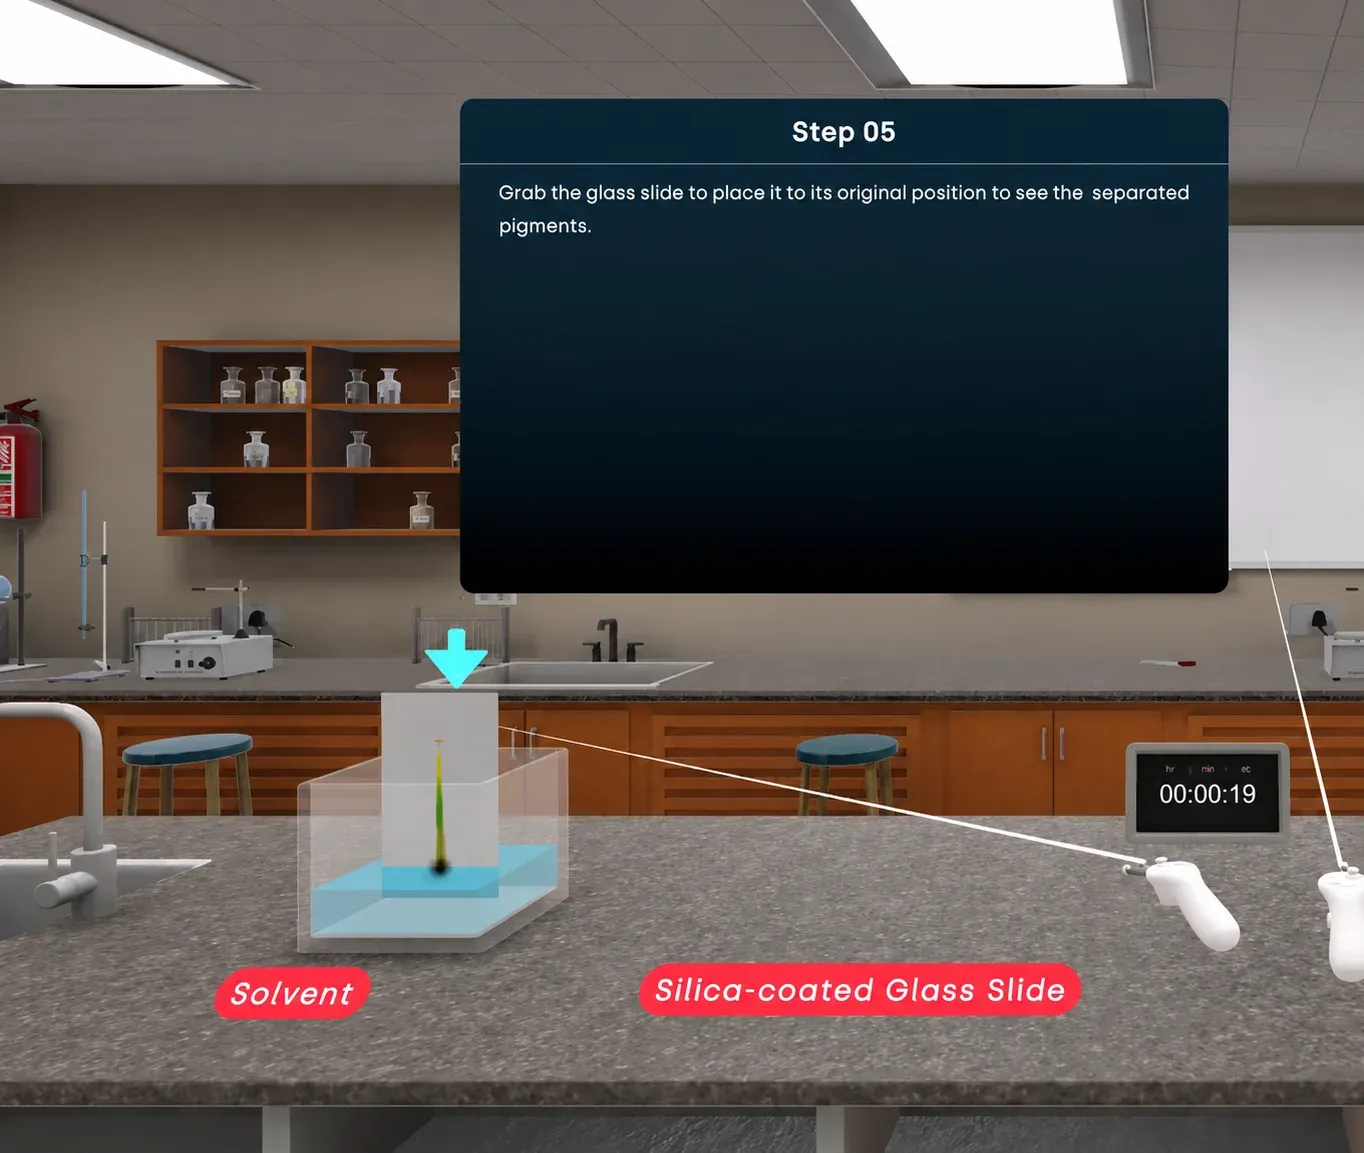
- Watch the solvent front carry components up the slide
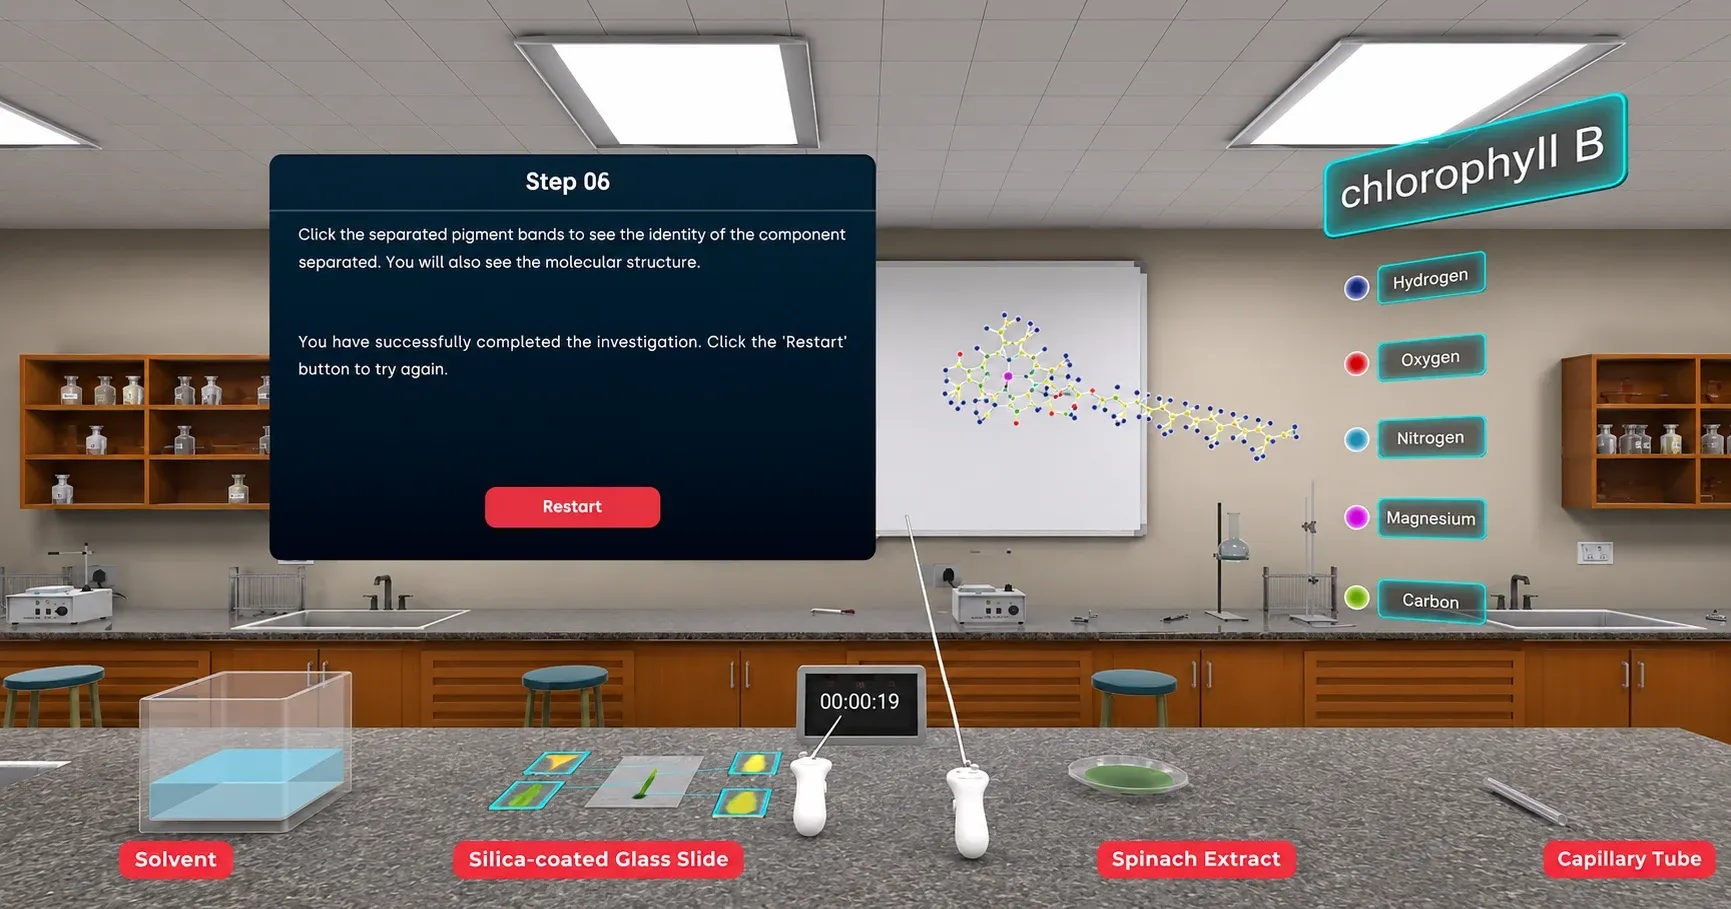
- Click each separated band to reveal its identity and structure
- Measure distances and calculate the Rf value
How faculty use it
- Pre-lab preparation before the real chemistry practical
- Unlimited repeats with no solvents or plates consumed
- Demonstration of separation for large groups
- Assessment of technique and Rf calculation
The module explains core organic chemistry concepts such as adsorption, polarity, solvent front, retention factor, mobile phase selection, and stationary phase interaction, and helps learners avoid common errors - overspotting, incorrect solvent level, a disturbed baseline, improper chamber saturation, and inaccurate Rf measurement. It works well as a pre-lab activity, a virtual lab, or an assessment. The 7thi AI tutor and built-in assessment run throughout.
How the module works
Students run a complete TLC workflow. They prepare the plate and mark the baseline, apply the sample with a capillary tube, develop the plate in a solvent chamber and watch the solvent front rise, then identify the separated spots after development. Each separated band can be clicked to reveal the identity and molecular structure of that component, which links the physical separation back to the chemistry that drives it - something a real plate cannot do. Students measure the distance travelled by each component and by the solvent front and calculate the Rf value, repeating until they are confident about what they are measuring and why.
What students take away
A student can carry out a TLC separation end to end, calculate and interpret Rf values and explain why they are only meaningful when the conditions are stated, and recognise the common errors - overspotting, wrong solvent level, a disturbed baseline - that quietly ruin a real plate. They can also connect each separated band to the compound it represents, tying separation to identification.
In the classroom
Analytical and organic chemistry courses use the module as pre-lab preparation and as a way to give students far more runs than solvent and plate budgets allow. It lets learners practise the common errors safely, calculate Rf values until the concept is secure, and identify each separated band directly. Pharmacy and life-sciences programmes use it to introduce chromatographic separation before the physical lab.
Interactive features and modes
Students prepare the plate and baseline, apply the sample with a capillary tube, develop the plate in a solvent chamber and watch the solvent front rise, then identify the separated spots. Each band can be clicked to reveal the component and its molecular structure, and the Rf value can be measured and recalculated as often as needed. The common errors that ruin a real plate can be explored safely.
Why it matters
Thin-layer chromatography is one of the first analytical techniques a chemistry student meets, and it teaches the central idea that components separate because they interact differently with a stationary and a mobile phase. But solvents, plates and sample material are consumed on every run, so students rarely get more than one attempt, and the errors that ruin a plate waste it each time. A virtual workflow gives unlimited runs, safe practice with the common mistakes, and the ability to identify each band directly.
The bigger picture
Thin-layer chromatography introduces one of the central ideas of analytical chemistry: that components can be separated because they partition differently between a stationary and a mobile phase. Understanding the Rf value - and why it is only meaningful when the conditions are specified - is a first lesson in the care that quantitative analysis requires. Being able to click a separated band and see the compound it represents links the physical separation directly to the underlying chemistry, so students grasp not just how to run the technique but why it works.
Devices, deployment and assessment
Deploying the module is straightforward. It runs on Meta Quest, ClassVR and Pico headsets, on WebXR-compatible browsers, and on the desktop without any headset at all, so a department can start with the hardware it already has and scale as it grows. Faculty can assign the whole module or specific scenes, set it as pre-lab preparation or post-lab revision, and track progress on a dashboard that records concepts mastered, time per scene and assessment scores, with export to the LMS via xAPI. The 7thi AI tutor answers student questions in context throughout, so learners are never left stuck and faculty are not fielding the same question forty times.
Who this module is for
- Chemistry undergraduates from Year 1 studying analytical or organic chemistry
- Pharmacy, biotechnology and life sciences programmes
- Diploma and polytechnic science students
- Faculty running pre-lab preparation before the real chemistry practical
Syllabus alignment
Where this module fits.
UGC / NEP 2020 (India)
Supports experiential, digital, skill-based, and practical chemistry learning across science and laboratory education.
NAAC / OBE
Supports ICT-enabled teaching, virtual lab exposure, practical learning outcomes, and student engagement in laboratory-based courses.
University syllabi
Maps to B.Sc. Chemistry, Organic Chemistry, Analytical Chemistry, Pharmaceutical Chemistry, and Life Sciences practical syllabi. Request a custom mapping.
TVET / Lab technician training
Supports chromatography familiarisation, lab procedure awareness, sample preparation, observation skills, and analytical testing workflows.
Keep exploring
Related modules.
See Thin Layer Chromatography live in a demo.
Thirty minutes, the full module, your curriculum questions answered.
What does the TLC workflow cover?
Preparing the plate, marking the baseline, applying the sample with a capillary tube, developing in the solvent chamber, watching the solvent front rise, and identifying the separated spots after development.
How is the Rf value taught?
Students measure the distance travelled by each component and by the solvent front, then calculate and interpret the ratio - and see why Rf is only meaningful when the conditions are stated alongside it.
Which common TLC errors does it cover?
Overspotting, incorrect solvent level, a disturbed baseline, improper chamber saturation and inaccurate Rf measurement - the mistakes that quietly ruin a real plate.
Can students find out what each band is?
Yes. Clicking a separated band reveals the identity and molecular structure of that component, which links the physical separation back to the chemistry driving it.
Does it integrate with our LMS?
Yes. Moodle, Canvas and Blackboard are supported, with SSO and xAPI export of session data and assessment results.
Can this replace our physical lab?
It precedes and extends the lab rather than replacing it. Students arrive knowing the procedure, so scarce bench time goes on technique instead of familiarisation.
What prior knowledge do students need?
Foundation-level tlc. The module suits UG Year 1+ and above, including diploma and polytechnic cohorts.
How long is a typical session?
About 15 minutes for a full run including assessment. Students can pause and resume, and faculty can assign specific parts rather than the whole module.
What does the TLC workflow cover?
Preparing the plate, marking the baseline, applying the sample with a capillary tube, developing in the solvent chamber, watching the solvent front rise, and identifying the separated spots after development.
How is the Rf value taught?
Students measure the distance travelled by each component and by the solvent front, then calculate and interpret the ratio - and see why Rf is only meaningful when the conditions are stated alongside it.
Which common TLC errors does it cover?
Overspotting, incorrect solvent level, a disturbed baseline, improper chamber saturation and inaccurate Rf measurement - the mistakes that quietly ruin a real plate.
Can students find out what each band is?
Yes. Clicking a separated band reveals the identity and molecular structure of that component, which links the physical separation back to the chemistry driving it.
Does it integrate with our LMS?
Yes. Moodle, Canvas and Blackboard are supported, with SSO and xAPI export of session data and assessment results.
Can this replace our physical lab?
It precedes and extends the lab rather than replacing it. Students arrive knowing the procedure, so scarce bench time goes on technique instead of familiarisation.
What prior knowledge do students need?
Foundation-level tlc. The module suits UG Year 1+ and above, including diploma and polytechnic cohorts.
How long is a typical session?
About 15 minutes for a full run including assessment. Students can pause and resume, and faculty can assign specific parts rather than the whole module.